2GIS Pro
A convenient and powerful geoanalytics tool for making business decisions. Analyze large amounts of data and easily visualize the results directly on the map.
Manage data on the map


Try it now for just 2,500 ₽
Assess the location before opening a café, restaurant, or store. Competitors, demand, audience, traffic, infrastructure — everything on a single dashboard. 2GIS data is updated weekly.

Find a suitable place for business in 5 minutes
Analyze your competitors:
identify their weak points and your own growth opportunities.
Understand your audience:
find out who lives and works nearby
Get ready-made insights:
make decisions based on data, not intuition;
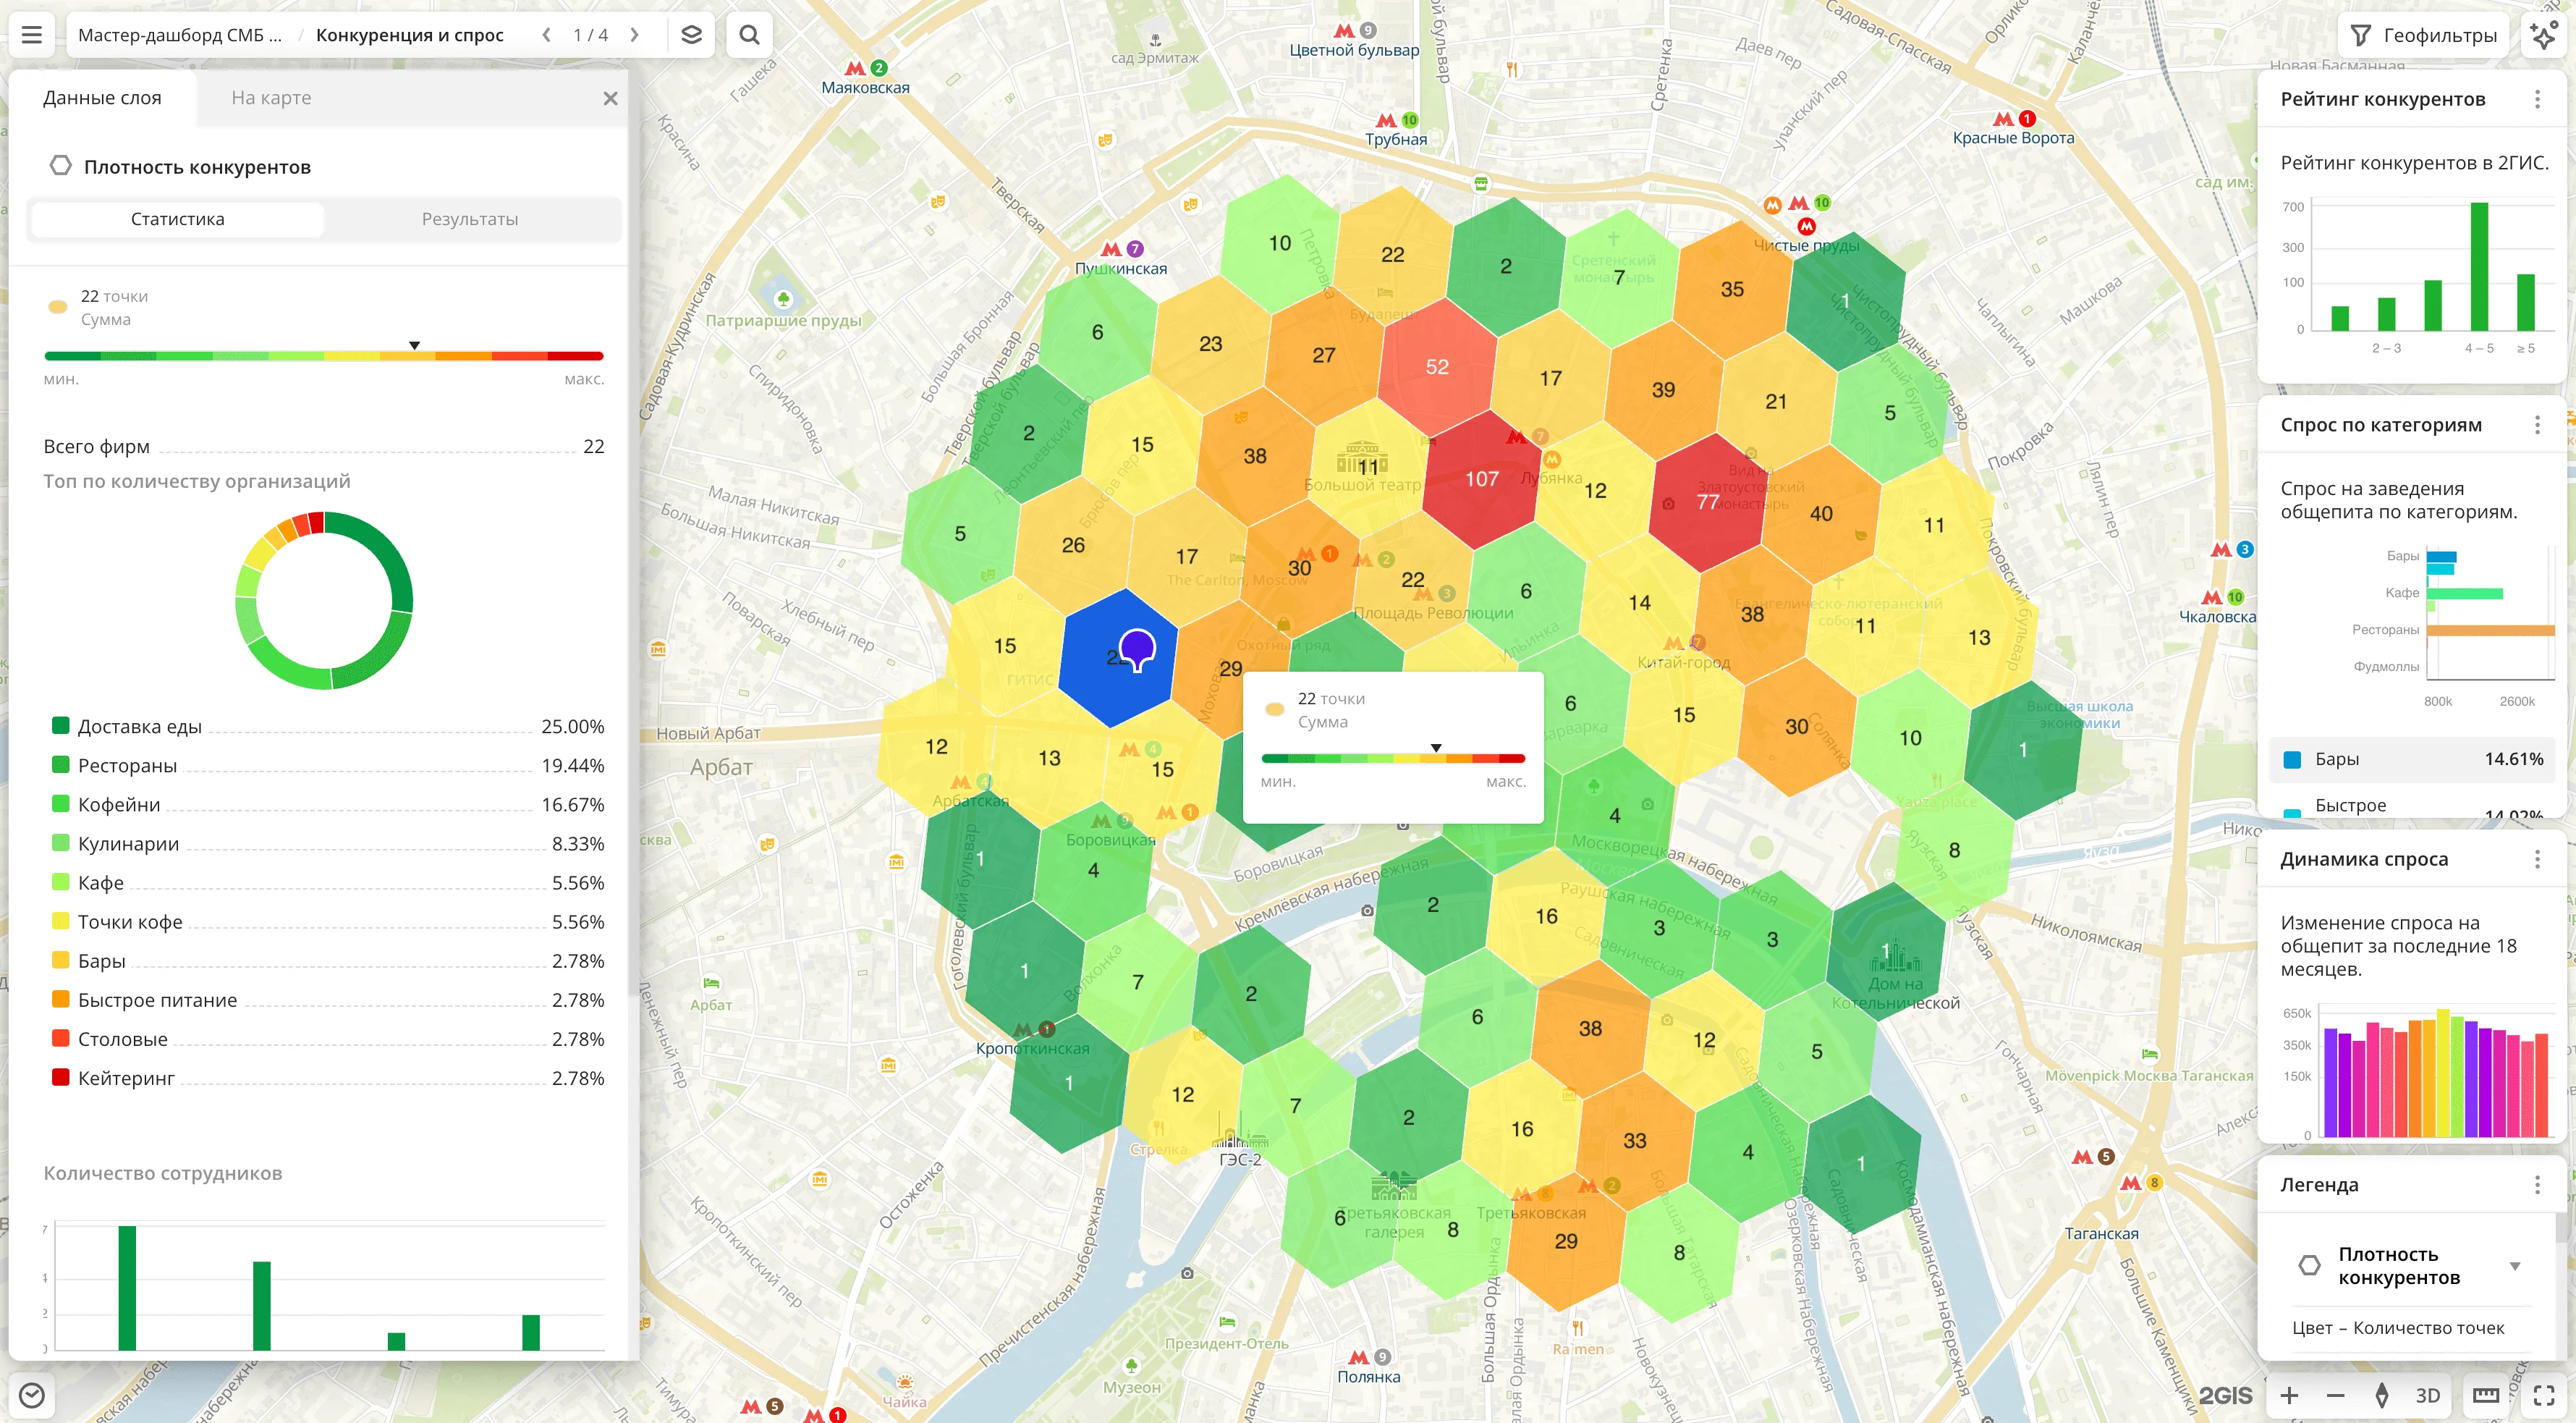
What will you see on the dashboard?
All the data you need to make the right decision — on one screen.
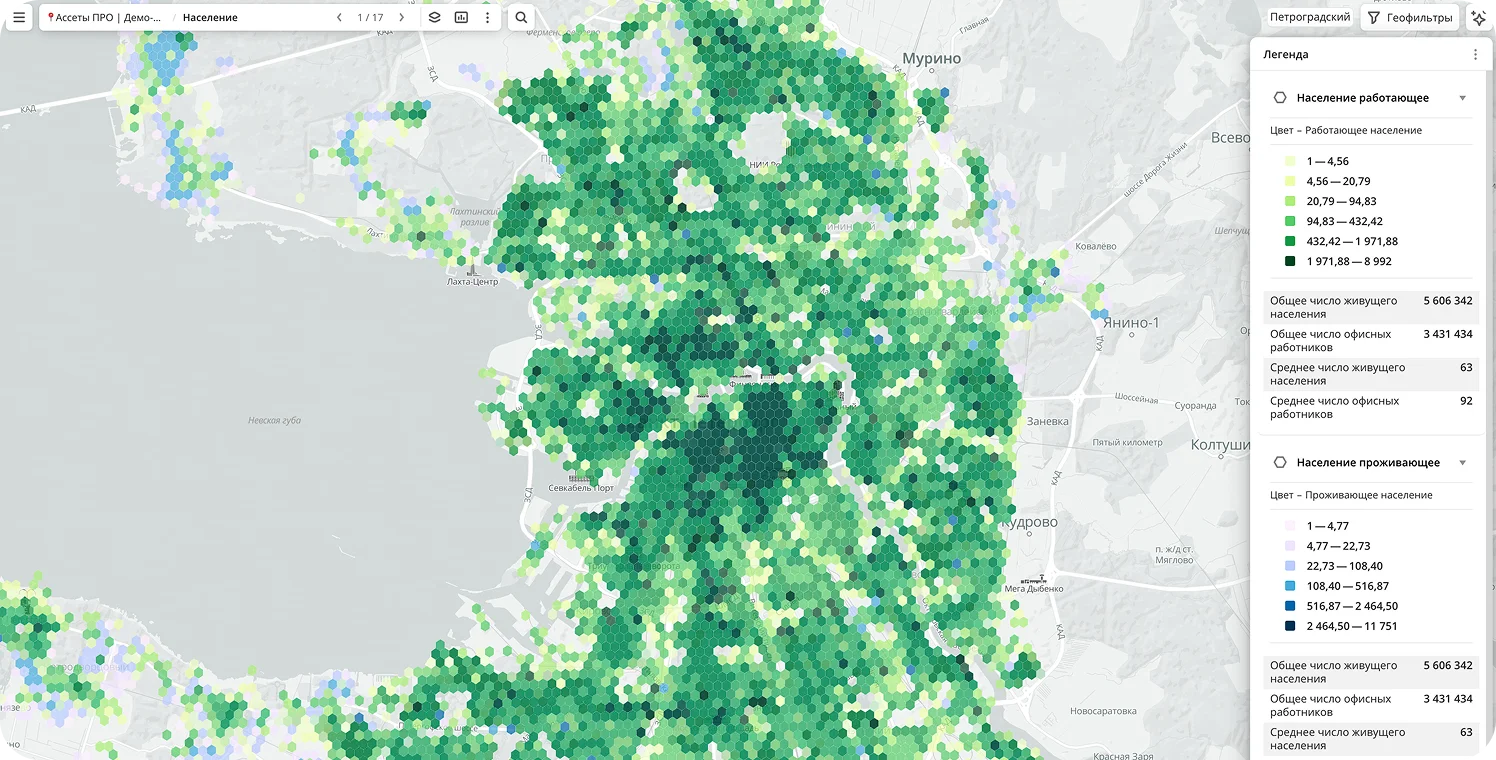
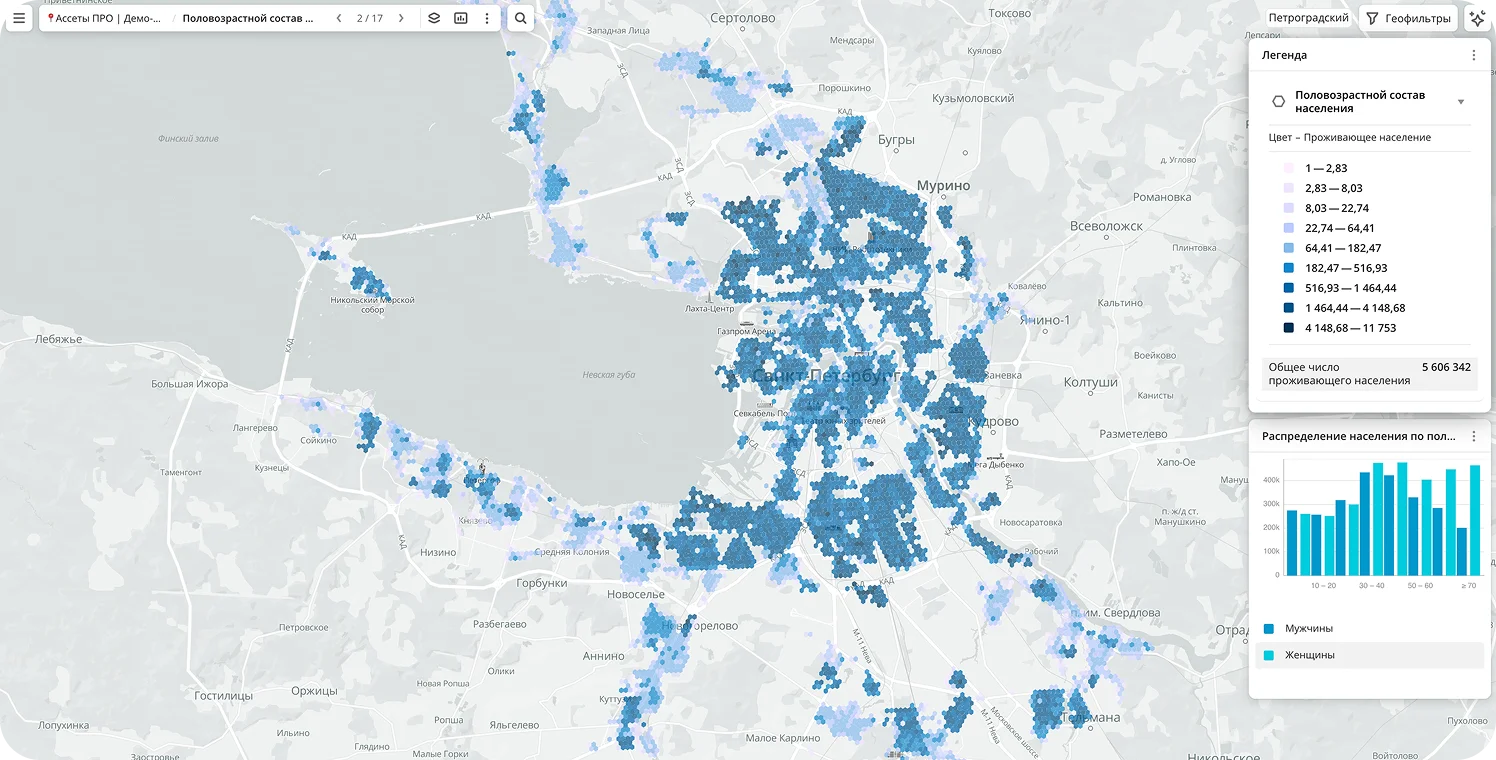
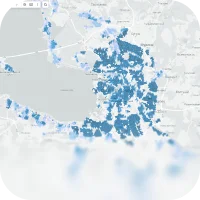
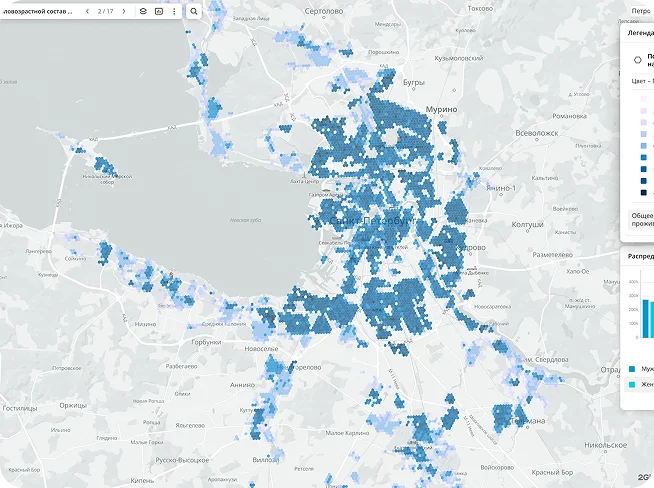
Audience profile
detailed demographic data on residents and workers in the area
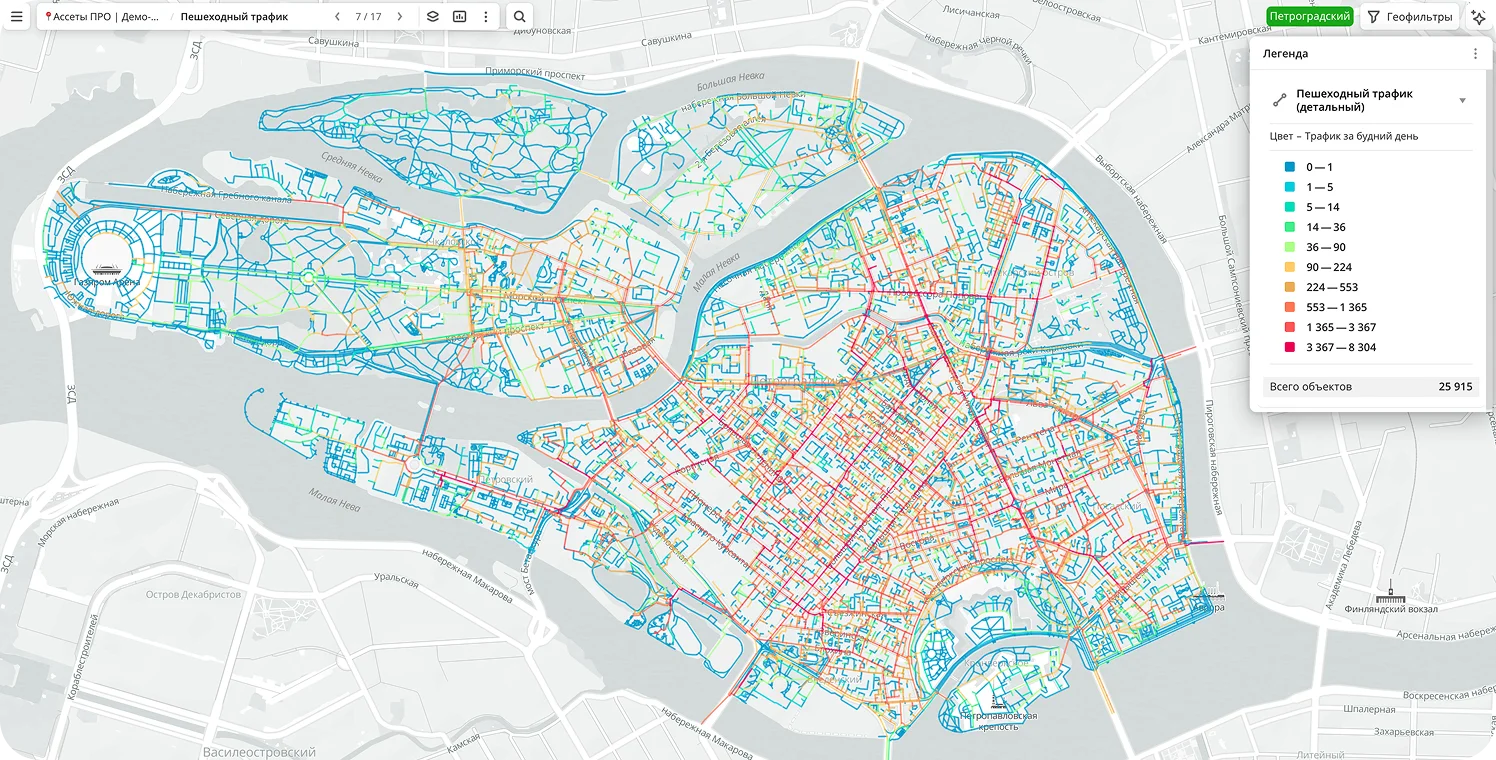
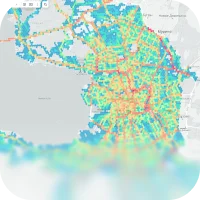
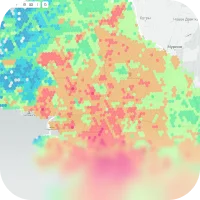
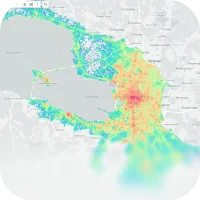
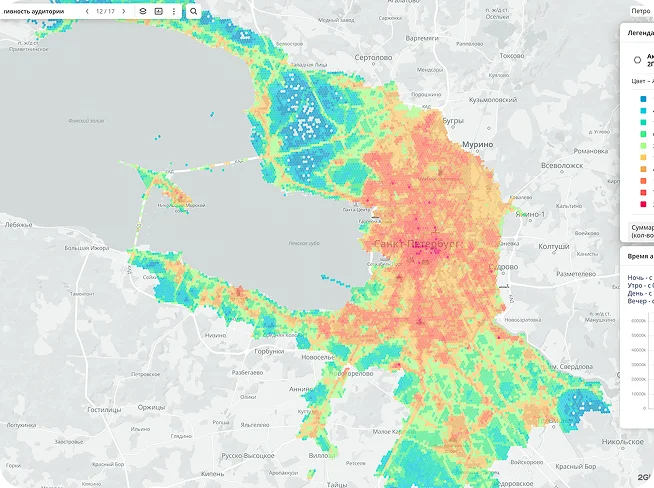
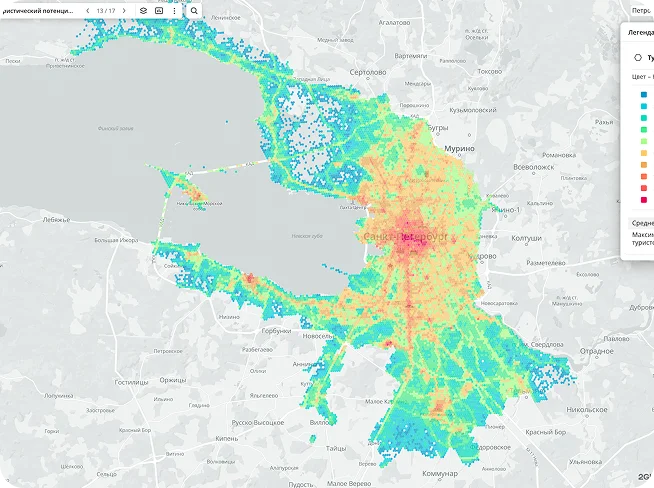
Pedestrian traffic
A 24/7 heatmap of activity around your location
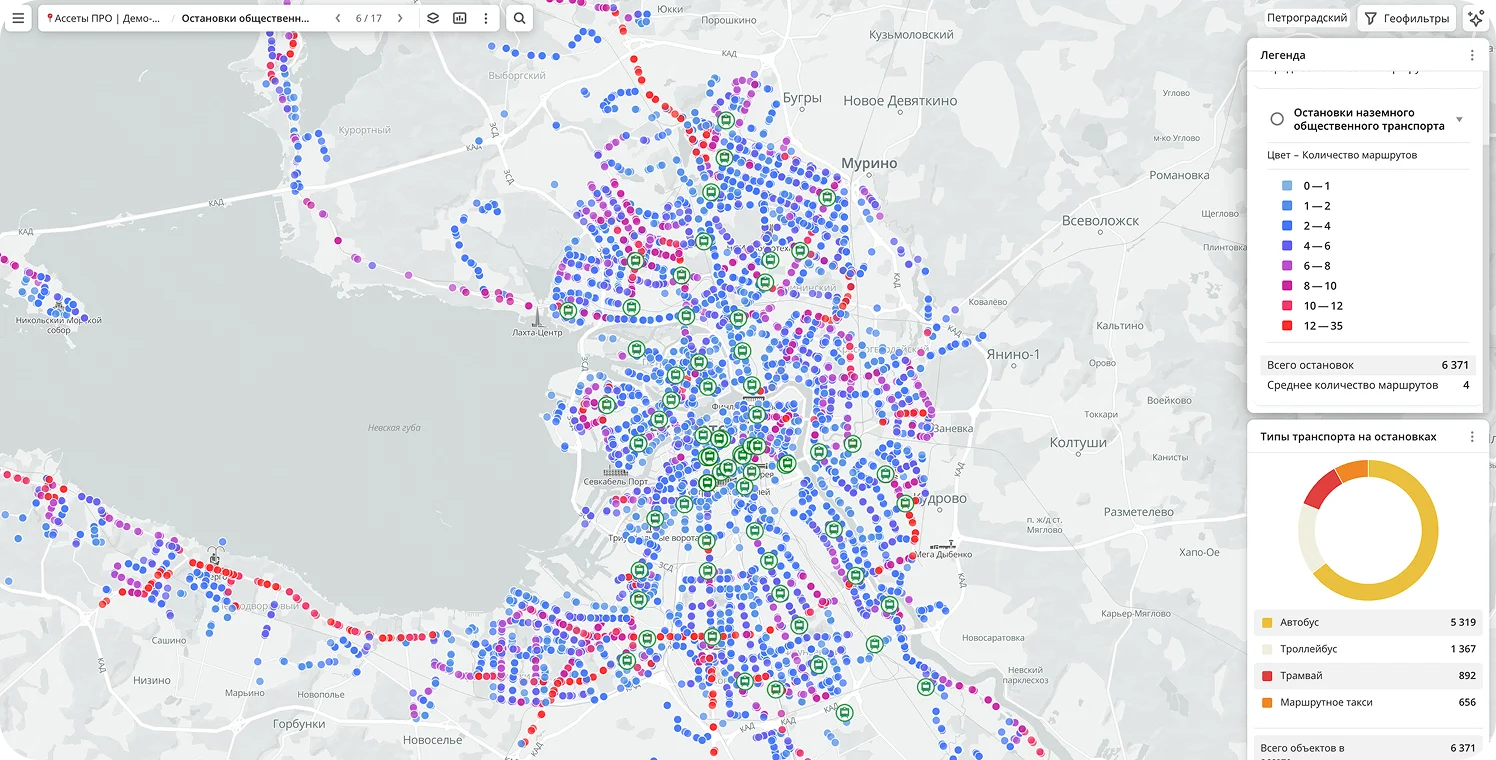
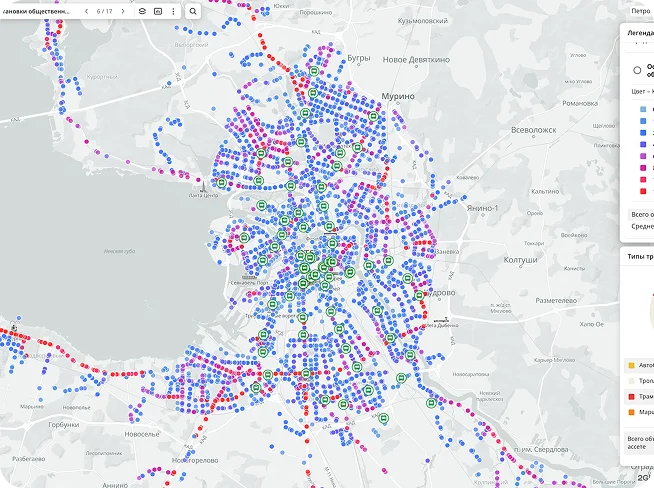
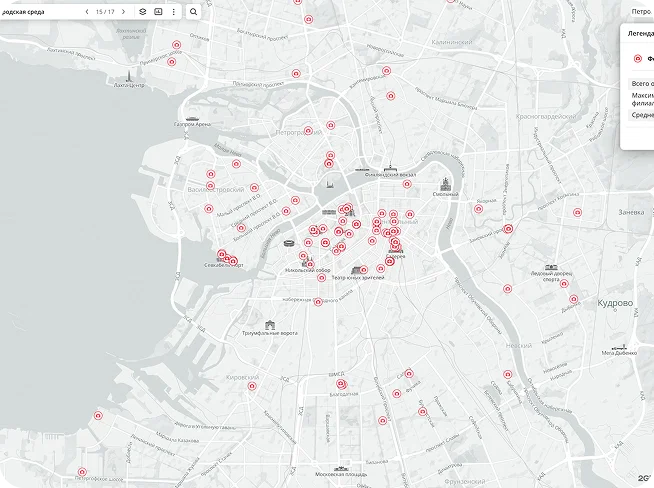
Infrastructure
bus stops, business centers, parks — everything that generates traffic flow
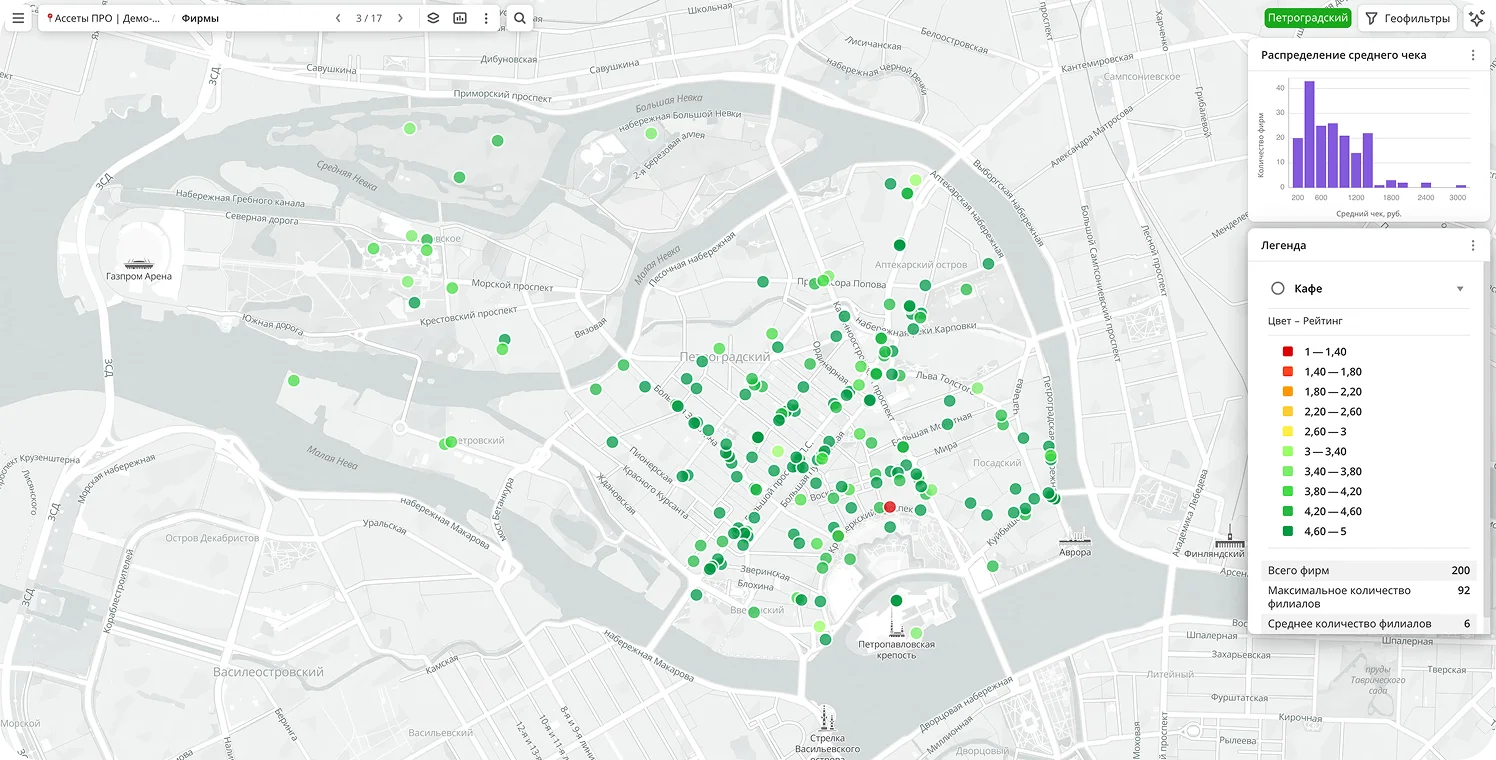
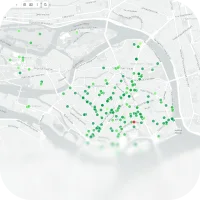
Competitors
location, ratings, and rush hours
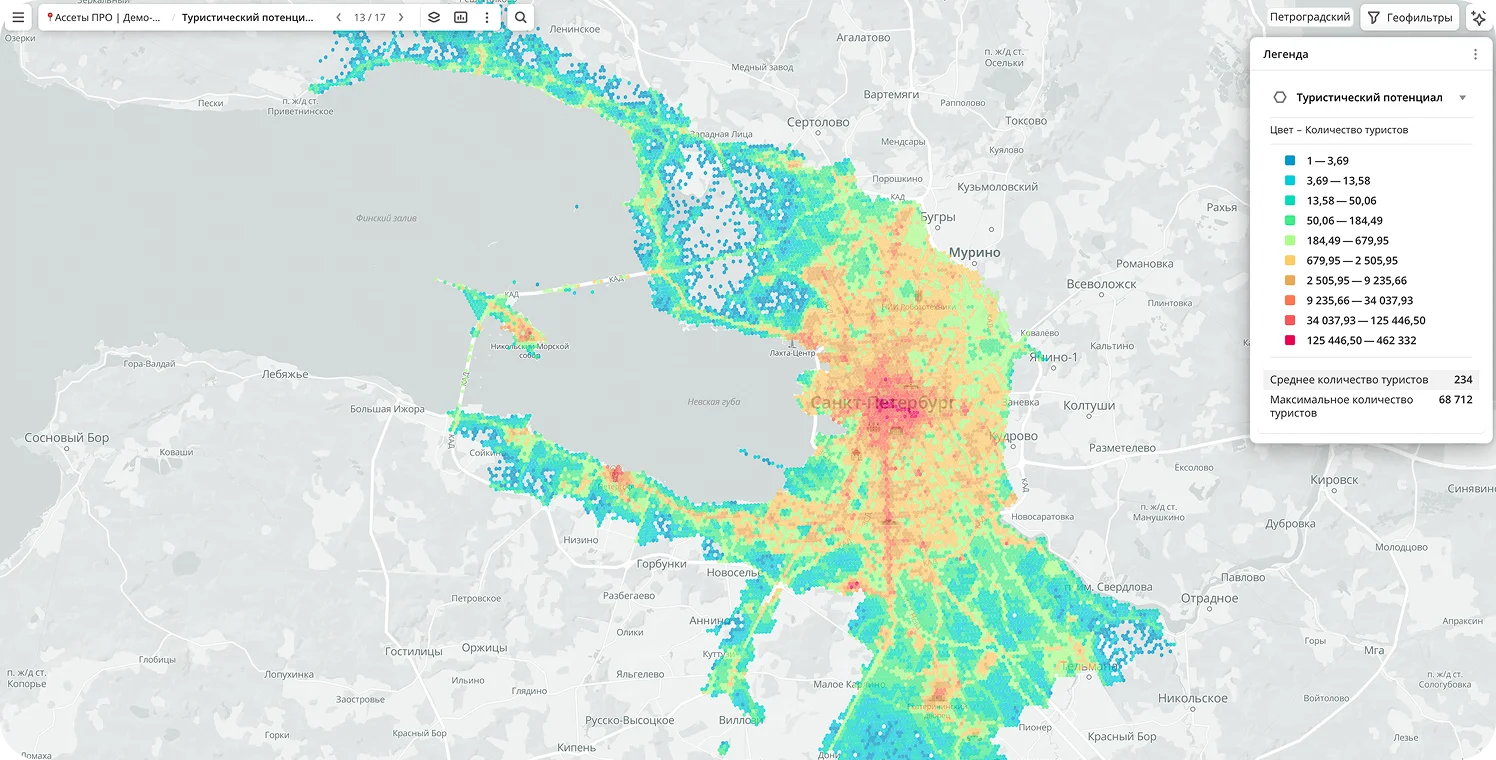
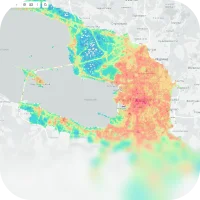
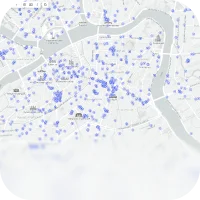
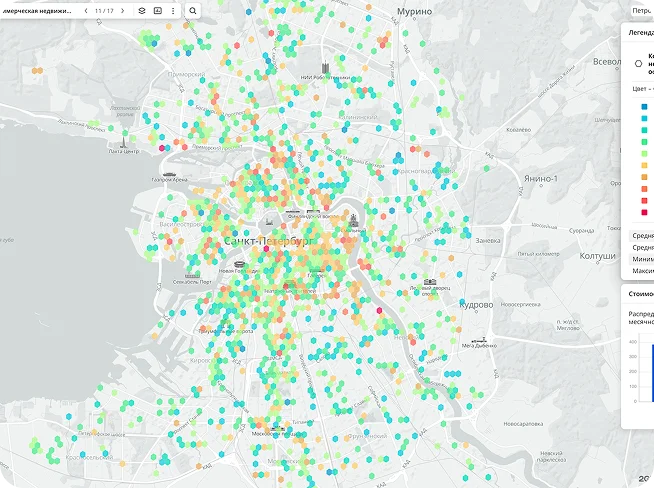
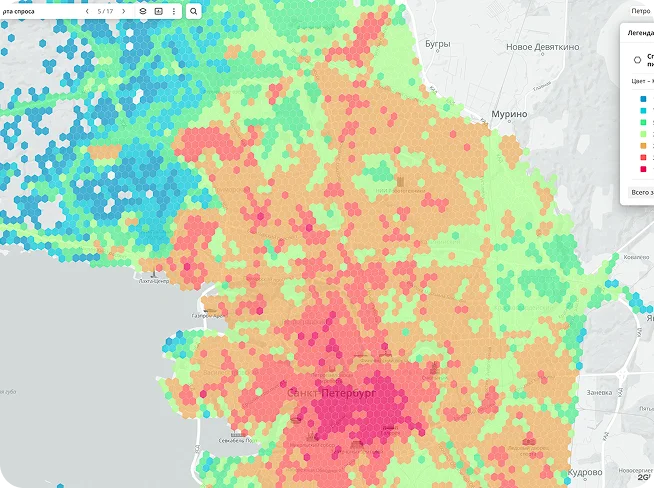
Demand map
where do people most often search for the services you offer
Important: you will receive access to an interactive dashboard with live data instead of a static PDF report.
Application Scenarios and Industries
Geomarketing is about using geography to make smarter business decisions.
Industries that apply geomarketing

Retail and franchises
Store location optimization
Analysis of infrastructure impact on point-of-sale performance
Competitive environment monitoring
Logistics and delivery planning with traffic data

FMCG
Optimizing merchandisers’ routes and visit coverage
Demand analysis by territory
Competitive environment analysis by product coverage areas
Monitoring of sales by region and shipments to distribution centers

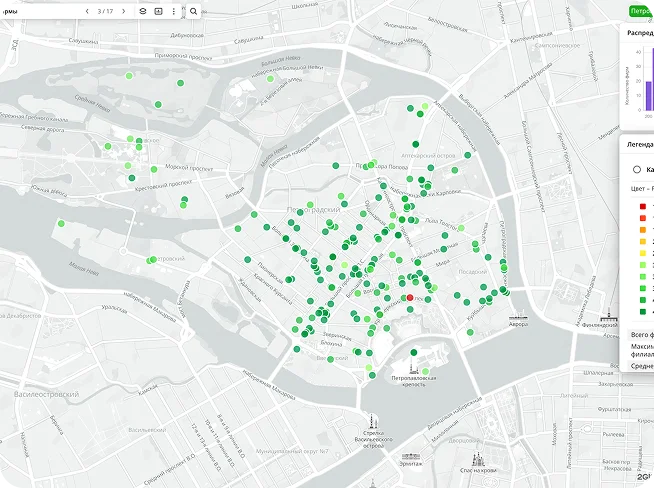
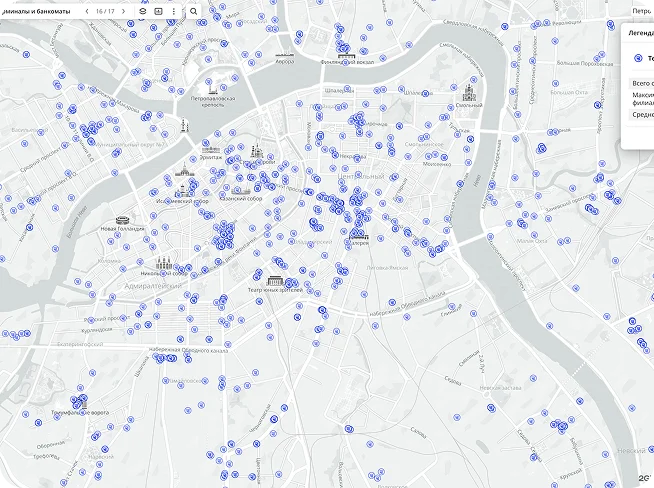
Financial sector
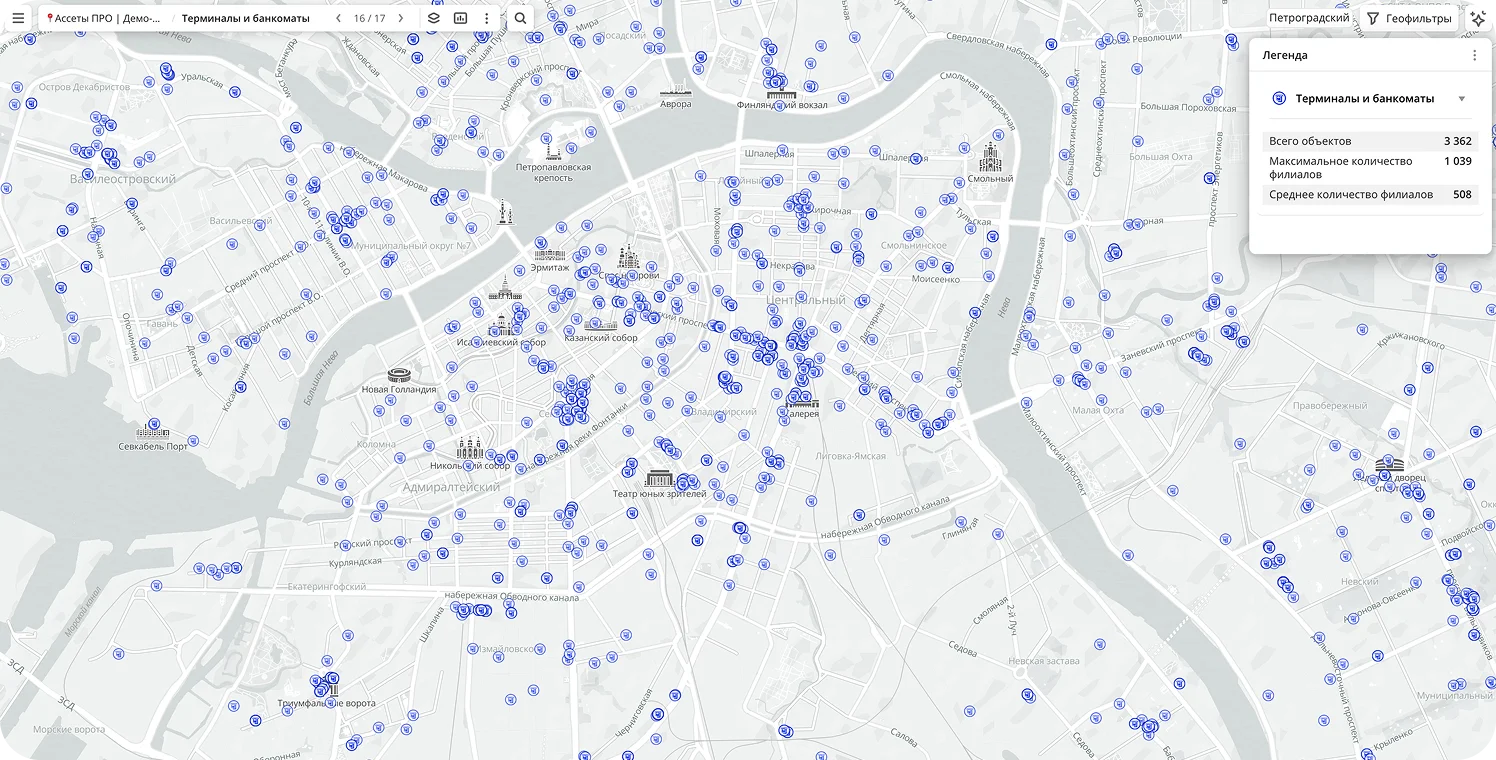
Optimization of branch and ATM locations based on customer density
Analysis of economic activity in different regions
Optimization of routes for field service employees
Geoportals are interactive online platforms for working with spatial data.
Industries that apply geoportals:
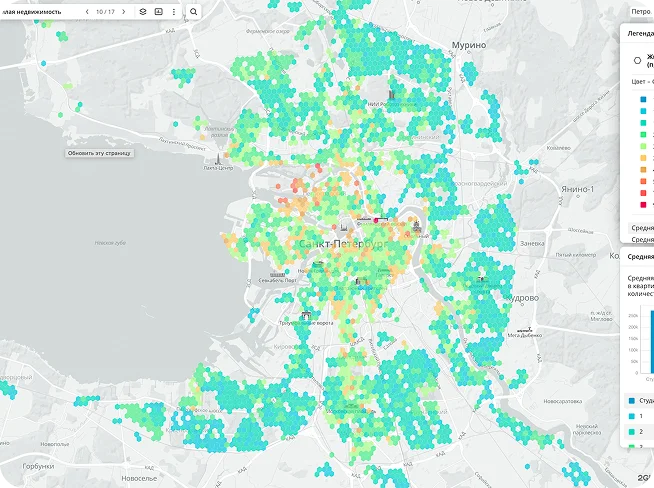
Real estate
Choosing location for new projects
Analysis of accessibility and infrastructure (roads, schools, hospitals)
Residential complex planning based on demographic data
Planning green areas and public spaces
Logistics and transport
Optimization and analysis of delivery routes
Analysis of pickup point efficiency based on location
Analysis of infrastructure impact on logistics
Competitive environment analysis
Infrastructure and safety
Analysis of educational and recreational accessibility for residents
Identification of medical facility shortages and their accessibility zones
Assessment of road infrastructure safety and interaction with emergency services
Ready-to-use data sets for territory and infrastructure analysis
2GIS Pro includes data on millions of companies, buildings, and infrastructure facilities, as well as insights into 2GIS user interests. This provides a highly accurate understanding of where your potential customers live and work — and where they most often search for goods and services like yours.
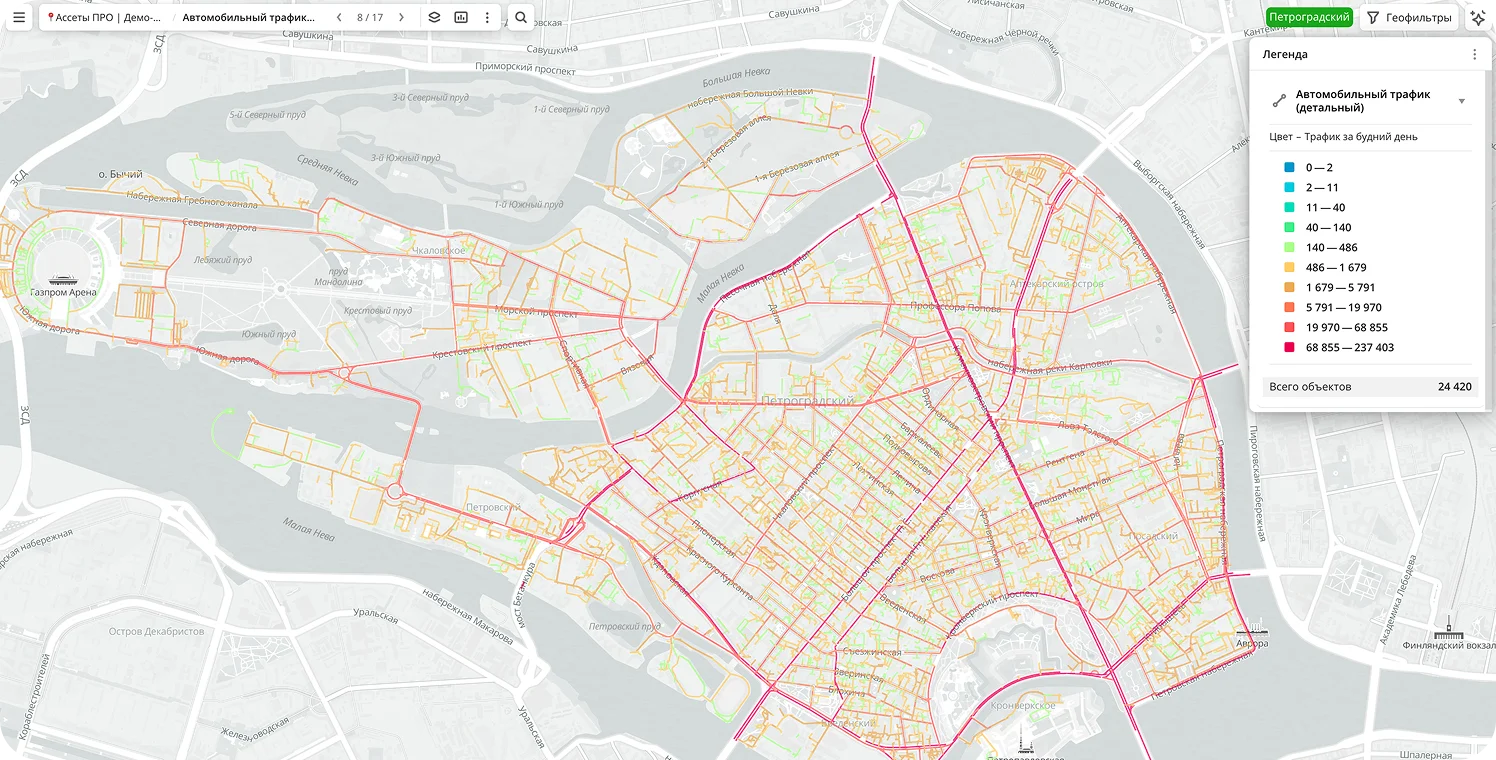
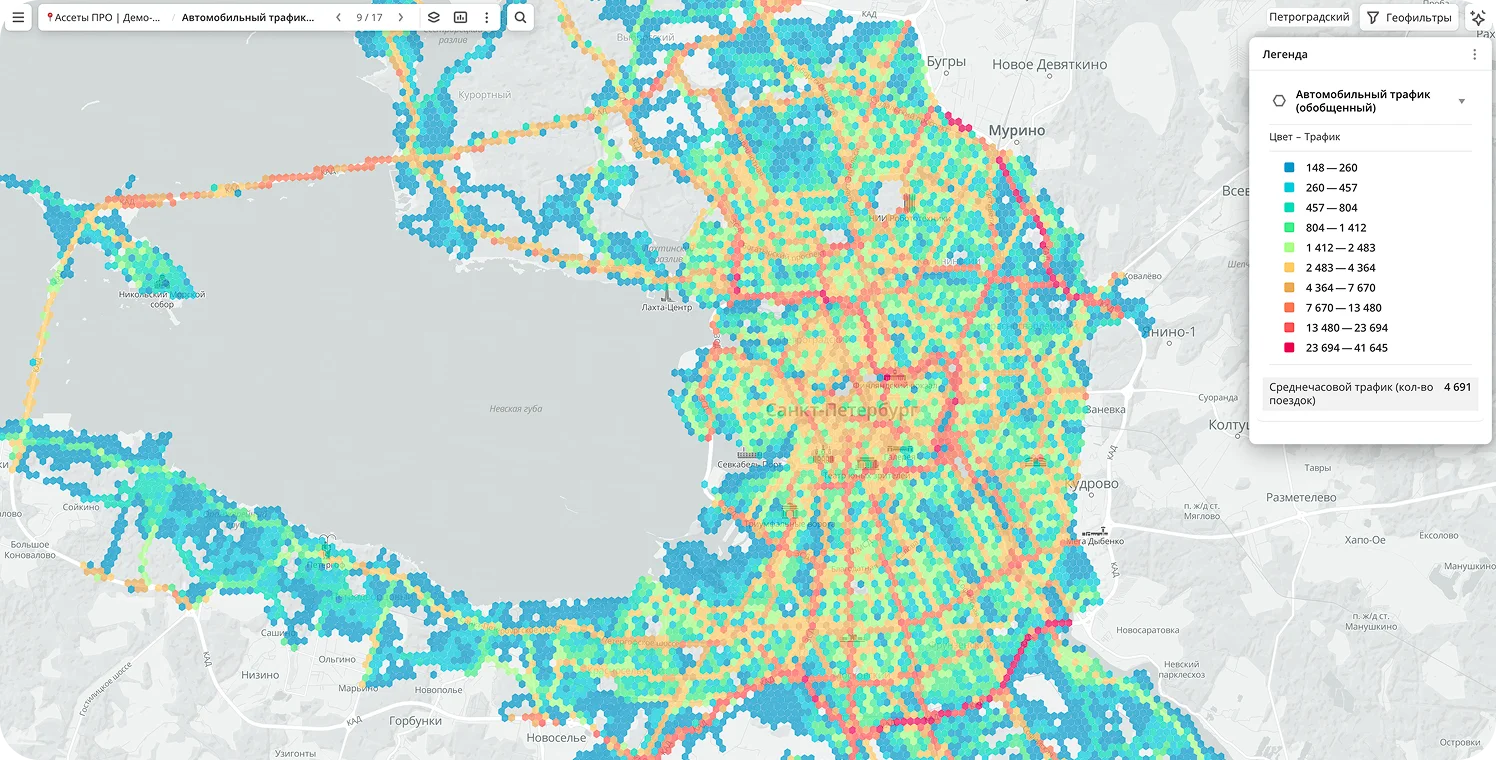


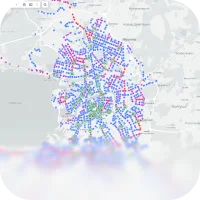

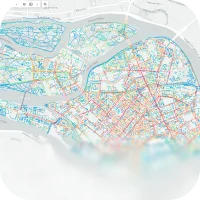

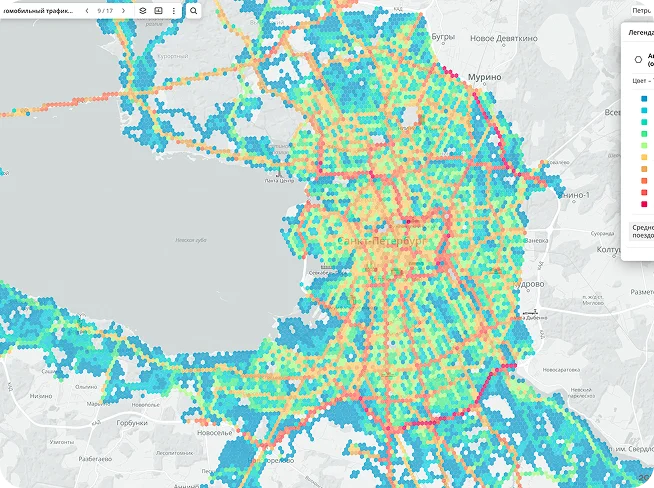
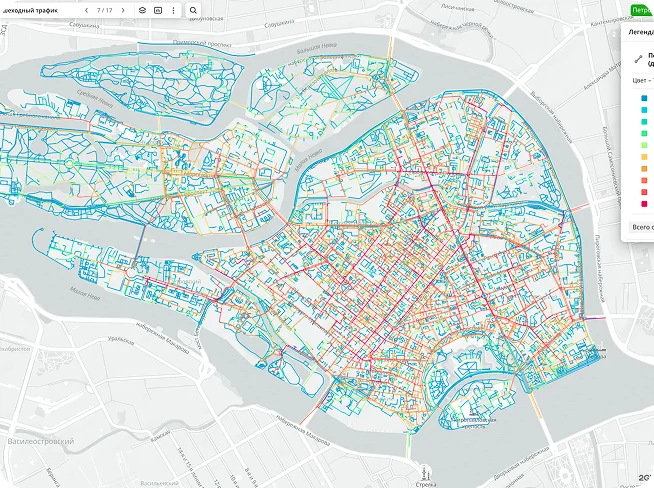
Car traffic — detailed view
Street traffic by hour and day of the week — to choose the best location for your business or advertising.


Analytics for business on a city map
The 2GIS city directory and business services provide up-to-date analytics and reports for selected locations.

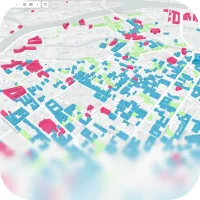
Add your own data to 2GIS data on demand, population, companies and buildings. Upload them to 2GIS Pro and evaluate locations using data synergy. Compare the metrics of your facilities with territory analysis and increase business efficiency.
Create polygon accessibility areas for multiple purposes: select walking or transport accessibility, configure the number of zones (from 1 to 5), select the time period of each zone, set merging or separation of zones.

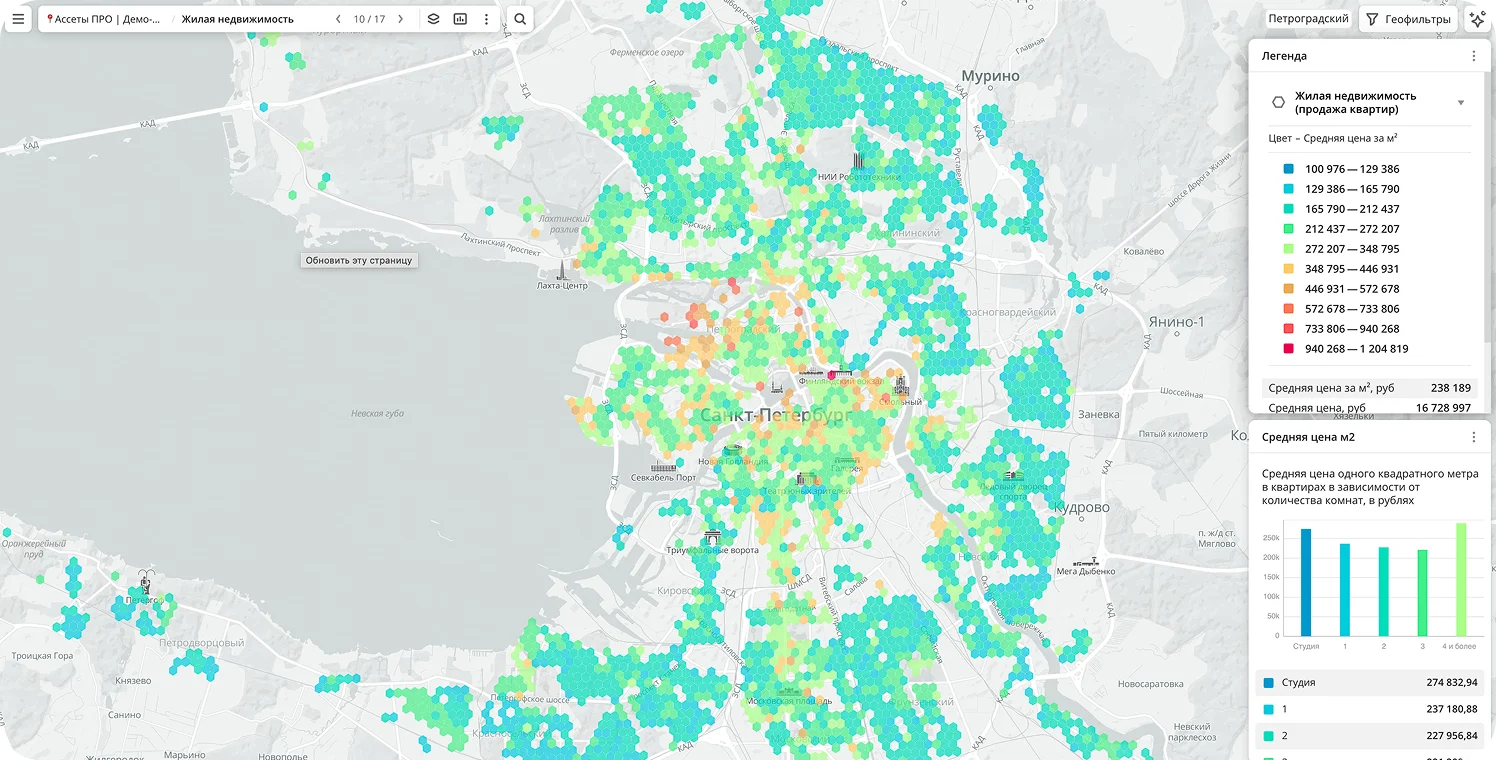
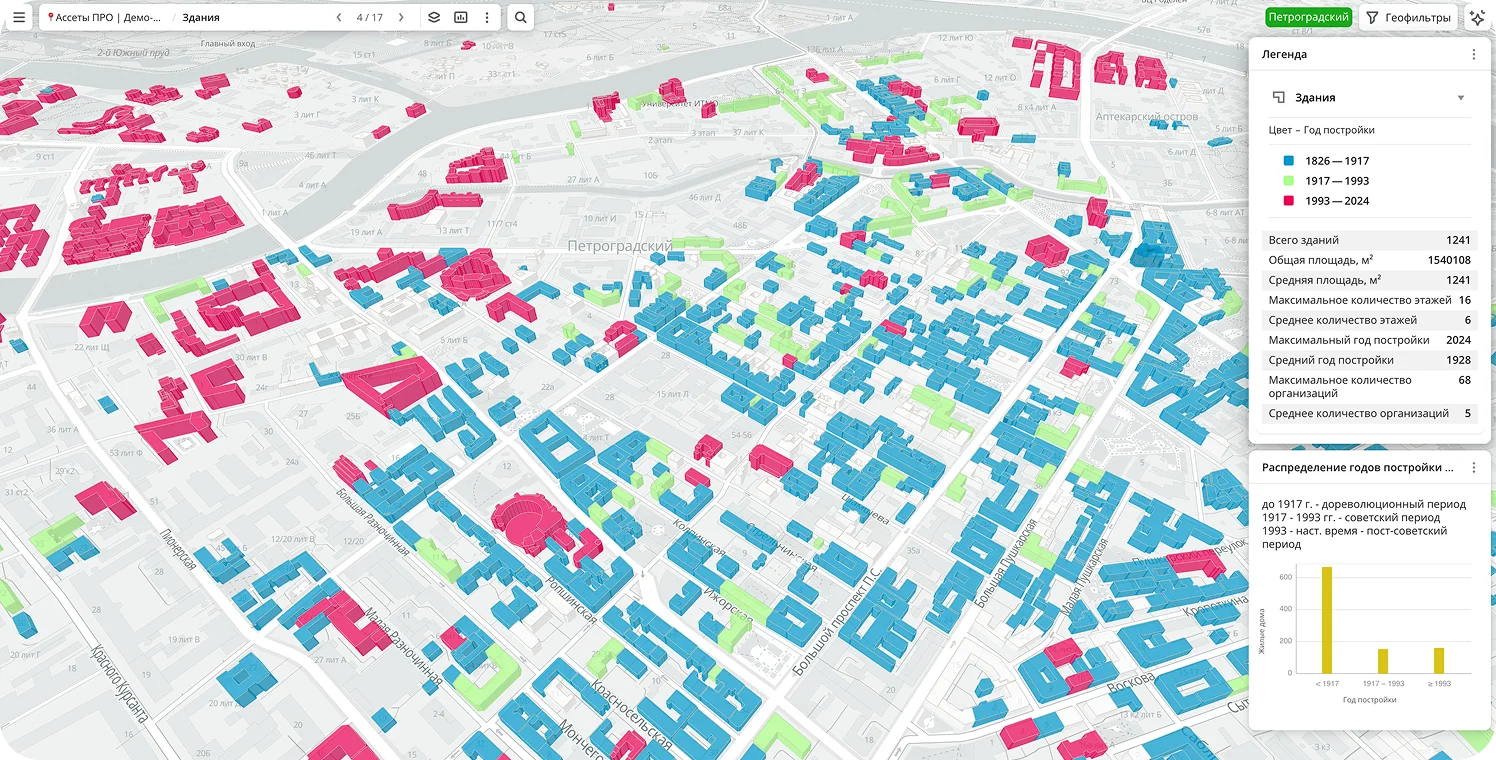
View detailed data and statistical cuts for any element on the map. Detailed and instant statistics at any scale: consider the entire city or its individual sections — districts, neighborhoods and even houses.


Flexible configuration of analytical parameters with dozens of filters. Create and combine data layers to evaluate locations based on hundreds of criteria. Make informed decisions based on accurate data.

Add your own data to 2GIS data on demand, population, companies and buildings. Upload them to 2GIS Pro and evaluate locations using data synergy. Compare the metrics of your facilities with territory analysis and increase business efficiency.
Flexible configuration of analytical parameters with dozens of filters. Create and combine data layers to evaluate locations based on hundreds of criteria. Make informed decisions based on accurate data.
View detailed data and statistical cuts for any element on the map. Detailed and instant statistics at any scale: consider the entire city or its individual sections — districts, neighborhoods and even houses.
Create polygon accessibility areas for multiple purposes: select walking or transport accessibility, configure the number of zones (from 1 to 5), select the time period of each zone, set merging or separation of zones.
On-Premise
Maps, directory, and navigation for websites and mobile apps — from a widget to a full-scale geoinformation service. Detailed documentation for developers is available.

Four reasons to choose 2GIS Pro
The 2GIS city directory and business services provide up-to-date analytics and reports for selected locations.

Data accuracy in 2GIS is 95%. We explain how we achieved that

User-friendly interface. Collect geoanalytics in just a few clicks. Use built-in scenarios and add your own data

AI Assistant. The AI builds reports on the map and helps you find anomalies and growth areas based on your query

Flexible deployment. Option for on-premises deployment within the client’s infrastructure